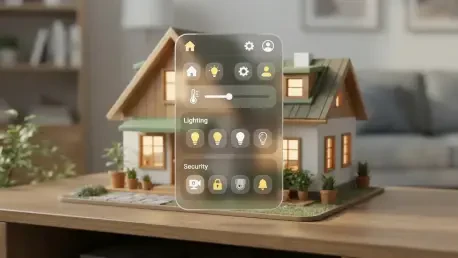

Research indicates that creating a single automation scene can require navigating a labyrinth of sub-menus and confirmation screens, leading to significant task completion delays. As smart home ecosystems expand to include an ever-growing array of connected devices, the digital interfaces used to manage them have become increasingly difficult to navigate. Modern applications often suffer from what industry experts call “usability bloat,” a condition characterized by cluttered nested menus, inconsistent feedback, and confusing setup procedures that frustrate even tech-savvy users. To solve this, the MAOV framework—Monitor, Analyze, Optimize, and Validate—has been introduced as a structured way to regain control over user experience. By utilizing multimodal data and machine learning, this framework identifies specific interaction bottlenecks, allowing developers to move beyond intuitive design toward a rigorous, data-driven methodology that enhances user efficiency. This approach represents a paradigm shift in how interaction designers perceive friction, moving from subjective complaints to objective, measurable data points that highlight exactly where the interface fails to meet human expectations. By systematically breaking down every touchpoint within an application, designers can finally understand why certain features go unused while others cause persistent errors, leading to more intuitive and streamlined smart living environments.
Data Synchronization and Experimental Design
To test the effectiveness of this new approach, researchers conducted controlled experiments involving forty regular smart home users who represented a diverse cross-section of age groups and technical backgrounds. The study utilized a within-subjects design, carefully comparing a “baseline” prototype modeled after industry leaders like Huawei and Xiaomi against an “optimized” version developed through the MAOV framework. Participants performed seven realistic tasks, ranging from initial device pairing to complex cross-device control and voice-app hybrid interactions. This comprehensive testing environment ensured that the findings would be applicable across various platforms and device types in the broader smart home market, rather than being limited to a single software ecosystem. By simulating high-stakes scenarios like security system arming and energy management, the researchers captured how users behave under pressure, providing a realistic look at the daily friction points that characterize modern smart home management. The rigor of the study design allowed for a direct comparison between standard design practices and data-driven optimizations, proving that even minor structural changes can have profound impacts on overall usability and user confidence.
The “Monitor” phase of the framework relies on five synchronized data streams to create a complete and uncompromising record of user behavior during each interaction. These streams include detailed application event logs to map every navigation path and tap, eye-tracking data to reveal visual focus and “dead zones” where users look but find no information, and voice logs to measure the accuracy of speech commands versus manual overrides. Additionally, interface telemetry tracks system performance—such as screen loading lag or device connection errors—while subjective surveys like the NASA-TLX capture the user’s perceived psychological workload and frustration levels. By aligning these disparate data points using a shared millisecond timestamp server, researchers can determine with surgical precision if a delay is caused by system latency, poor icon recognition, or fundamental human confusion. This granular level of detail is a significant upgrade from traditional analytics, which often only show that a user left a page without explaining why. The resulting dataset provides a holistic view of the “User-Task-Node” relationship, exposing the invisible hurdles that make smart home technology feel like a chore rather than a convenience.
Quantifying Friction and User Archetypes
A critical innovation of this research is the Interaction Bottleneck Index (IBI), a mathematical formula used to quantify friction at specific points in the user journey. The IBI calculates a score based on a weighted average of dwell time, error rates, and “back-action” rates, which occur when a user retreats to a previous screen after failing to find a target. By focusing redesign efforts on the “top-third” of high-friction nodes, designers can prioritize the most problematic areas of the interface rather than wasting resources on parts that are already functional. This targeted approach ensures that optimizations are applied where they will have the most significant impact on the overall flow, such as the often-convoluted process of setting up conditional “if-then” automation rules. The sensitivity analysis performed on the IBI showed that it consistently identifies the same problem areas regardless of minor variations in user speed, making it a reliable diagnostic tool for long-term interface development. This shift toward a quantitative index allows software teams to set objective benchmarks for usability, ensuring that new feature releases do not inadvertently degrade the user experience.
To further refine the optimization process, the study employed the Adaptive Multi-modal Behavioral Fusion Network (AMBF-Net), a deep learning model that segments users into distinct archetypes based on their interaction patterns. The research identified three groups: Efficient users, who complete tasks rapidly with minimal errors; Hesitant users, who are slowed by uncertainty and spend long periods scanning menus; and Error-Prone users, who move quickly but frequently make mistakes or trigger unintended actions. This segmentation proves that a universal, “one-size-fits-all” interface design is often ineffective for a modern household. For example, hesitant users require clearer labels and explanatory tooltips, while error-prone users benefit from streamlined paths and larger touch targets that prevent accidental clicks. By understanding these different behavioral profiles, developers can create adaptive interfaces that offer more guidance to those who need it while staying out of the way of power users. This level of personalization is becoming essential as smart home technology moves into the mainstream, where users vary wildly in their comfort levels with digital systems and automated home controls.
Implementation and Performance Gains
The “Optimize” phase translates these deep data insights into tangible interface improvements by surgically reducing the number of steps required for the most common tasks. For example, the device pairing process was shortened significantly by integrating QR-code detection and automatic Wi-Fi credential filling, which eliminated the need for manual input. Similarly, status monitoring was simplified by moving live device states directly to the main dashboard, removing the requirement to tap through multiple layers of menus just to see if a light was left on. These interventions were not about making random cuts or simply hiding features; they were evidence-based adjustments designed to eliminate the root causes of friction identified during the initial analysis phase. The redesign focused on cognitive load reduction, ensuring that the most important information was always the most accessible. By streamlining the hierarchy of information, the researchers created a more “flat” interface that allowed for faster navigation without sacrificing the powerful features that advanced users expect from their smart home applications.
The results of these targeted optimizations were substantial, with task completion times dropping by nearly half in categories such as device group management and scene creation. Beyond simple speed, error rates were slashed by over 50%, and the average System Usability Scale score rose from a “marginal” 61.45 to a “good” 78.10. Furthermore, the psychological demand on users decreased significantly, as measured by standard workload assessments, indicating that the new interface was not just faster, but also much less stressful to use. These metrics demonstrate that a node-level diagnostic approach can fundamentally transform the quality of interaction in complex digital environments, making the technology feel more like a natural extension of the home rather than a complex technical puzzle. The improvement was especially noticeable for “hesitant” users, who saw the largest gains in confidence and speed when using the new template-based automation setups. Such dramatic improvements suggest that current industry standards for smart home apps have significant room for growth if developers adopt more rigorous, multimodal testing frameworks.
Future Directions for Smart Home Research
Despite these successes, researchers acknowledged that laboratory settings cannot fully replicate the complexities of real-world home environments where network instability and the chaos of daily routines are constant factors. Moving from 2026 to 2029, the focus must shift toward longitudinal studies that observe how these usability gains hold up as users transition from novices to “power users” over several years of daily use. There is also the question of “habituation,” where users might become so accustomed to a poorly designed interface that they stop noticing its flaws, even as those flaws continue to waste their time. Future research will need to explore how the MAOV framework can be integrated into live, over-the-air update cycles to continuously refine apps based on real-world telemetry data. Additionally, more research is required to determine the optimal number of iterative cycles needed before reaching a point of diminishing returns in interface refinement. Understanding how environmental noise—both literal and digital—affects voice control accuracy in a busy kitchen or living room will also be a key area for upcoming studies in multimodal interaction.
The transition toward multimodal behavioral analysis represented a significant shift from “expert intuition” to a sophisticated engineering discipline that prioritizes the user’s cognitive health. By combining telemetry, eye-tracking, and machine learning, developers gained a transparent view of the user experience that was previously obscured by subjective feedback and incomplete logs. This methodology ensured that as the Internet of Things continued to grow in complexity through the late 2020s, the interfaces used to control our homes remained accessible, efficient, and stress-free for all types of users. The project successfully demonstrated that data-driven redesigns could alleviate the burden of “usability bloat,” turning a collection of disconnected devices into a truly integrated and user-friendly ecosystem. Ultimately, the work proved that the most powerful smart home feature was not a new piece of hardware, but a well-designed interface that respected the user’s time and mental energy. Moving forward, the industry was encouraged to adopt these multimodal standards to ensure that technology serves the home, rather than requiring the inhabitants to serve the technology.